RKTracer is a code coverage tool for IAR Embedded Workbench IDE. It measures function, statement, decision, condition, MC/DC and multi-condition coverage for C and C++, on the IAR C-SPY simulator or on the real target connected to your host. Instrumentation happens at compile time, so you never edit your source files and you never touch your build settings beyond toggling RKTracer.
The flow is short: integrate RKTracer with IAR once, turn it on from the Tools menu, clean and rebuild, run your tests, and generate an HTML report. The sections below reproduce every step and every command, including limited-memory tuning, auto-save macros, merging multiple test runs, the scriptable command-line mode for CI, and multi-project workspaces. For the wider picture see the RKTracer overview, the full list of coverage metrics, and the embedded targets guide. Browse all toolchains in the documentation.
Integrate RKTracer with rktracer -iar -integrate, turn it on from Tools · RKTracer ON, clean and rebuild and test on the simulator or the real target, save the coverage data, then run RKTracer Report or rkresults to generate the HTML report.
Integrate RKTracer with IAR Embedded Workbench
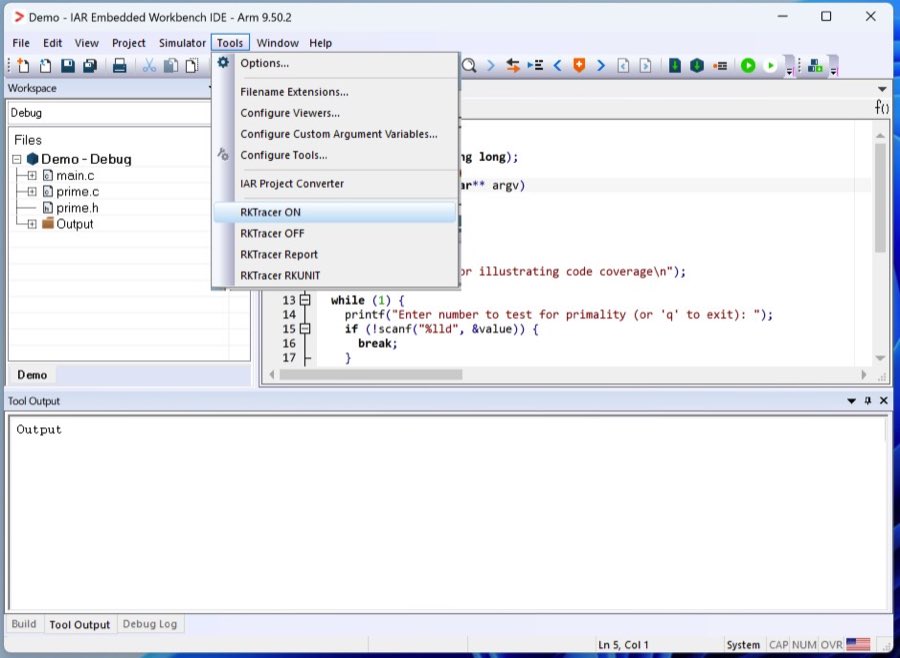
Integrating RKTracer adds the RKTracer ON and RKTracer Report entries to the IAR Tools menu. You run this once per machine.
- Open Command Prompt. Press
Win + R, typecmd, and pressEnterto open the Command Prompt. - Execute the integration command. In the Command Prompt, run the command below to integrate RKTracer with IAR Embedded Workbench IDE.
> rktracer -iar -integrate
Prerequisites
- Ensure the RKTracer tool is successfully integrated.
- Build and test the application in debug mode at least once, then restart the IDE.
Memory management for limited-memory applications
If your application has limited memory, follow these steps to manage which source files are instrumented. This process generates an rktracer.config listing the number of source files that can be instrumented without exceeding the project memory.
Prerequisites: make sure the RKTracer tool is disabled.
Configure rktracer.config
- Navigate to the RKTracer installation folder (
C:\rktracer). - Open the
rktracer.configfile and setmode=shorton line three in options. For example:
options append browser mode=short squeeze
Enable the "List" option in IAR Embedded Workbench
- Go to
Project·Options... - Navigate to
C/C++ Compiler·[List] - Enable the
Output list fileoption.
Analyze project memory
Step 1: Open the project folder. Open Command Prompt and go to your project's debug or release folder where the List folder is created.
Step 2: Disable RKTracer. Make sure the RKTracer tool is disabled, then rebuild your project. This generates the .map and list files needed for the next step.
Step 3: Run the rkanalyze command. Use the following command format:
> rkanalyze "C:\Program Files (x86)\IAR Systems\Embedded Workbench 7.3\arm\bin\iccarm.exe" 43008 34000000 List/MassStorage.map
- Replace
43008with your project's ROM size in bytes. - Replace
34000000with your project's RAM size in bytes. - Make sure the path to
iccarm.exematches your actual IAR installation.
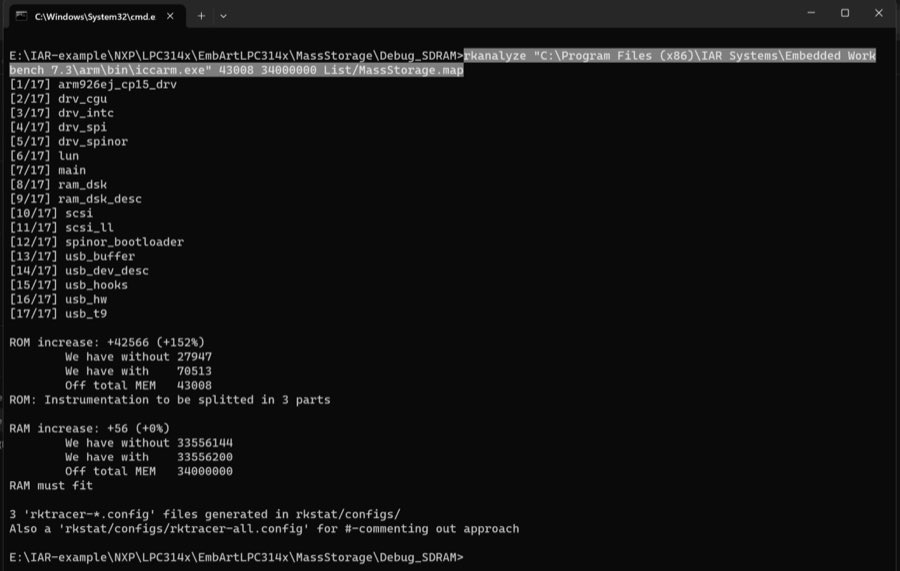
Step 4: Adjust instrumented source files. After running rkanalyze, go to the rkstat/configs folder in your project directory. You will see configuration files like:
rktracer-1.config
rktracer-2.config
rktracer-3.config, and so on
At the end of the rktracer-1.config file, you will see how many source files can be instrumented based on the ROM and RAM sizes provided during the rkanalyze run. Copy the rktracer-1.config file and paste it in the same folder as your project file (project.ewp). Rename the copied file to rktracer.config. This is important because the RKTracer tool only recognizes the file named rktracer.config.
Auto-save code coverage data
Setting this option means RKTracer automatically saves the code coverage data from runtime after you kill the debug process in IAR Embedded Workbench IDE.
- Right-click on your project and select
Options. - Go to
Debugger·Setuptab. - Enable
setup macrosand point to therktracer.macfile atC:\rktracer\share\rktracer\rktracer.mac.
Generate code coverage reports in the IAR IDE
Step 1: Enable the RKTracer tool. Go to the Tools menu · RKTracer ON. Grant read/write permissions if prompted; this is a one-time job.
Step 2: Rebuild and test the application.
- Rebuild the application. Every time you make changes to your project source code, you need to clean and build the project, as instrumentation takes place at the source code level.
- Run tests on the embedded simulator or target connected to the host machine.
Step 3: Save coverage data. The RKTracer tool automatically saves coverage data when you terminate the debug process. Alternatively, save coverage data manually:
- In debug mode, go to
View·Memory·Memory 1. - Search for
RK_MEM, and save memory asRK_MEM.hexin your project directory parallel to therktracerfolder in your project folder.
Step 4: Generate code coverage reports. Go to Tools · RKTracer Report to generate HTML reports. You can also open Command Prompt in your project folder and execute the rkresults command to generate HTML code coverage reports.
> rkresults
RKTracer converts RK_MEM.hex to rk-coverage.txt and maps it with the JSON files in the RKTracer folder to generate the reports.
Merging different code coverage reports
Instrument the project. Instrumentation prepares your project to collect coverage data during test execution, which is essential for accurate coverage analysis. Ensure your project is properly instrumented without any build errors, and verify that all necessary files and directories are instrumented by generating an empty code coverage report, either in the IDE or in the command line with rkresults.
Run tests and save coverage data
For each test run, you save the coverage data in raw-format files (RK_MEM_1.hex, RK_MEM_2.hex, and so on).
Step 1: Convert and save coverage data for the first test run. Run your tests to generate the first coverage data file (RK_MEM_1.hex). Convert the raw coverage data to JSON format and save it:
> tsvraw2json rktracer.tsv RK_MEM_1.hex
This command generates a file named rk-coverage.txt.
Step 2: Convert and save coverage data for subsequent test runs. For the second test run, generate the second coverage data file (RK_MEM_2.hex). Append the new coverage data to the existing rk-coverage.txt file:
> tsvraw2json rktracer.tsv RK_MEM_2.hex
Repeat this process for each additional test run (RK_MEM_3.hex, and so on), appending each new set of coverage data to the rk-coverage.txt file:
> tsvraw2json rktracer.tsv RK_MEM_3.hex
Continue this process for all remaining RK_MEM.hex coverage data files.
Handling partially instrumented project folders or files
If your project involves partial instrumentation, where only specific files or folders are instrumented:
Step 1: Generate coverage data for partially instrumented files. Run your tests on the partially instrumented files to generate the coverage data file (RK_MEM.hex). Convert the raw coverage data to JSON format and save it:
> tsvraw2json rktracer.tsv RK_MEM.hex
This generates a file named rk-coverage.txt.
Step 2: Rename and manage coverage files. Rename the generated rk-coverage.txt file to differentiate it, then delete the rktracer.tsv file from your project directory to prepare for the next set of instrumentation:
> mv rk-coverage.txt rk-coverage-binary1.txt
> rm rktracer.tsv
Step 3: Repeat for each set of instrumented files. Repeat Step 1 and Step 2 for each new set of partially instrumented files, generating new raw coverage files and converting them.
Finally, merge coverage data
Once all coverage data has been collected and converted, merge it into a single report. Run the following command to merge all coverage data files (rk-coverage*.txt) into a single report:
> rkresults rk-coverage*.txt
This command searches for all files matching the pattern rk-coverage_1.txt, rk-coverage_2.txt, and so on, merges their data, and generates a comprehensive code coverage report. By following these steps, you successfully merge different code coverage reports into a single comprehensive report.
Command-line mode of RKTracer in IAR
The command-line mode makes RKTracer scriptable for CI, so you can enable coverage, build with iarbuild.exe, generate the report and disable RKTracer, all without opening the IDE.
Step 1: Enabling RKTracer. To enable RKTracer, use the command below. It specifies the tool, the path to the IAR Embedded Workbench, and the path to your project file.
Command:
> rktracer -iar -enable "path_to_IAR\arm" "path_to_projectfolder\projectFile.ewp" -q -r
Example command:
> rktracer -iar -enable "C:\Program Files\IAR Systems\Embedded Workbench 9.2\arm" "C:\PWR_Freq_Mode\iar\PWR_Freq_Mode.ewp" -q -r
Explanation:
rktracer: the tool you are using.-iar -enable: flags indicating that you are enabling RKTracer for an IAR project."C:\Program Files\IAR Systems\Embedded Workbench 9.2\arm": the path to the IAR Embedded Workbench arm folder."C:\PWR_Freq_Mode\iar\PWR_Freq_Mode.ewp": the path to your project file.-q: runs the command in quiet mode, minimizing output. This option should not be ignored.-r: collects raw coverage data.
Step 2: Clean, build, and run tests. Use the following command to clean, build, and run tests on your project.
Command:
> "path_to_IAR\common\bin/iarbuild.exe" projectFile.ewp -build configuration -log all
Example command:
> "C:\Program Files\IAR Systems\Embedded Workbench 9.2\common\bin/iarbuild.exe" PWR_Freq_Mode.ewp -build ADSP_CM403F_Debug -log all
Step 3: Save code coverage file. After building and running your tests, save the code coverage file RK_MEM.hex to your project folder. This file contains the raw coverage data collected during your tests.
Step 4: Generate code coverage report. Navigate to your project folder in the Command Prompt and execute the rkresults command. Ensure you have the rktracer folder in your project and the RK_MEM.hex file.
Command:
> cd path_to_project_folder
> rkresults
Step 5: Disabling RKTracer. If you need to disable RKTracer, use the command with the -disable flag.
Command:
> rktracer -iar -disable "path_to_IAR\arm" "path_to_projectfolder\projectFile.ewp" -q -r
Example command:
> rktracer -iar -disable "C:\Program Files\IAR Systems\Embedded Workbench 9.2\arm" "C:\PWR_Freq_Mode\iar\PWR_Freq_Mode.ewp" -q -r
Explanation:
-disable: flag indicating that you are disabling RKTracer.
By following these steps, you can enable RKTracer, build your project, run tests, save the coverage data, generate a code coverage report, and disable RKTracer when needed.
Handling code changes in your project
If you make changes to the source code:
- Delete the
rktracer.tsvfile in your project folder. - Turn off the RKTracer tool, then turn it on again.
- Follow the steps above to generate code coverage reports.
> rm rktracer.tsv
By following these steps, you can integrate and use the RKTracer tool for code coverage in the IAR Embedded Workbench IDE effectively.
Handling multiple projects in the same workspace
This section helps you configure RKTracer to manage multiple projects within the same workspace. By following these steps you can generate a single rktracer.tsv file instead of multiple files for each project.
Step 1: Locate the rktracer.config file. Navigate to the RKTracer installation folder, which is typically where you installed RKTracer on your system. Find the rktracer.config file. This configuration file is crucial for setting various options, including specifying the path for the rktracer.tsv file.
Step 2: Set the tsv option in rktracer.config. Open rktracer.config in a text editor (for example Notepad or VSCode). Add the tsv option to specify the path to your workspace where you want the rktracer.tsv file to be generated. For example:
options append browser mode=short tsv=C:\Users\Project-workspace
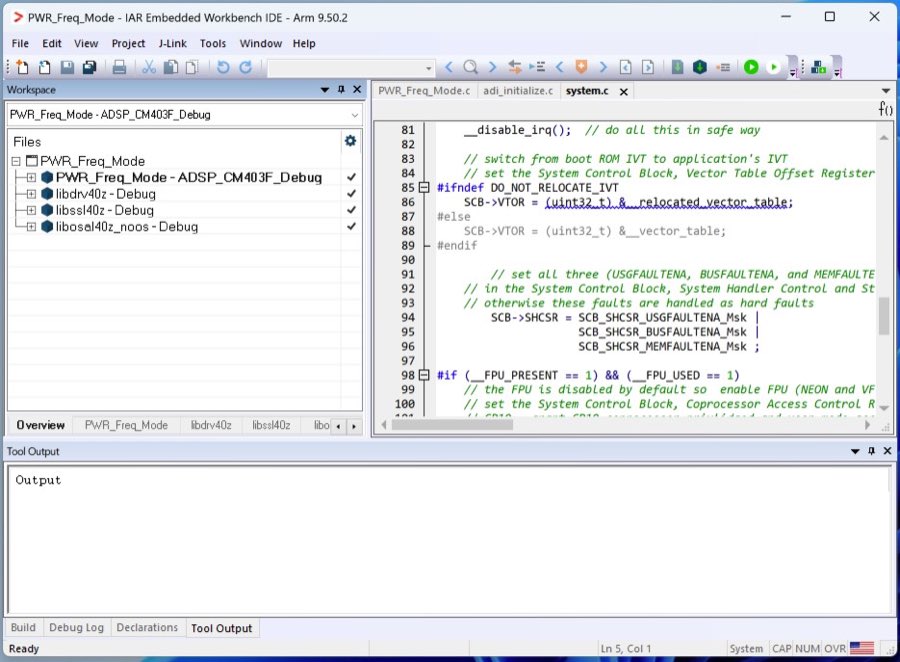
Main project
- PWR_Freq_Mode: this is your main project, and its output is a binary file. Ensure this project is set as the active project in your workspace.
Library projects
- libdrv40z: this is a library project.
- libssl40z: another library project.
- libosal40z: this is also a library project.
Building coverage on another toolchain too? See the companion guides for Keil uVision MDK-ARM and Code Composer Studio.
Frequently asked questions
How do I measure code coverage in IAR Embedded Workbench?
Integrate RKTracer once with rktracer -iar -integrate, then turn it on from Tools · RKTracer ON, clean and rebuild your project, run your tests on the simulator or the real target, and generate the report from Tools · RKTracer Report or with the rkresults command. Instrumentation happens at compile time, so there are no source changes.
Does RKTracer support MC/DC coverage in IAR?
Yes. RKTracer measures statement, decision, condition, MC/DC and multi-condition coverage for C and C++ built with IAR Embedded Workbench. MC/DC is the strongest structural coverage metric, and RKTracer measures it natively alongside the others.
Can I run RKTracer for IAR from the command line or CI?
Yes. Enable it with rktracer -iar -enable, build with iarbuild.exe, save RK_MEM.hex, generate the report with rkresults, then disable with rktracer -iar -disable. The -q quiet flag and -r raw-data flag make the flow scriptable inside Jenkins, Azure DevOps or GitLab CI.
How do I handle limited memory for instrumentation in IAR?
Set mode=short in rktracer.config, enable the Output list file option in the C/C++ Compiler List options, then run rkanalyze with your iccarm.exe path, ROM size and RAM size against the generated .map file. RKTracer writes config files telling you how many source files fit; copy rktracer-1.config next to your .ewp project and rename it rktracer.config.
How do I merge coverage from multiple test runs in IAR?
For each run save RK_MEM_1.hex, RK_MEM_2.hex and so on, convert each one with tsvraw2json rktracer.tsv RK_MEM_n.hex to append to rk-coverage.txt, then merge everything into one report with rkresults rk-coverage*.txt.
Do I need to change my source code to add coverage in IAR?
No. RKTracer instruments at the source level during compilation and adds its runtime automatically. You never edit your source files; you only toggle RKTracer on, clean and rebuild.
How do I auto-save coverage data when I stop debugging in IAR?
Right-click the project, open Options, go to Debugger · Setup, enable the setup macros and point to rktracer.mac at C:\rktracer\share\rktracer\rktracer.mac. RKTracer then saves the coverage data automatically when you terminate the debug session.
How do I handle code changes or multiple projects in one IAR workspace?
After changing source, delete rktracer.tsv, toggle RKTracer off and on, then rebuild. For a workspace with several projects, set the tsv option in rktracer.config to a shared workspace path so all projects write to one rktracer.tsv, with the binary project active and the libraries built alongside it.