This guide shows how to generate code coverage for Java and Kotlin Android apps in the Android Studio IDE using the RKTracer tool, with three simple steps:
- Enable the RKTracer tool and rebuild the application.
- Test the instrumented application and save the coverage data.
- Generate code coverage reports.
Install the RKTracer Android plugin in Android Studio, turn RKTracer ON from the Tools menu and rebuild, run your tests and pull rk-coverage.txt from the device, then run rkresults to generate the HTML reports.
Code Coverage tool integration with Android Studio IDE
Install the RKTracer plugin into the Android Studio IDE. Go to the File menu, then Settings, then Plugin. Click the setting icon and select install plug-in from disk.
Select the RKTracer-Android-Plugin.jar file from the plugins folder. On Windows the path is:
C:\rktracer\share\rktracer-plugins
On Linux the path is:
/home/username/rktracer/share/rktracer-plugins
Select RKTracer-Android-Plugin.jar and restart the Android Studio IDE. After restarting, the Tools menu shows the RKTrace option to turn RKTracer ON or OFF or to generate reports.
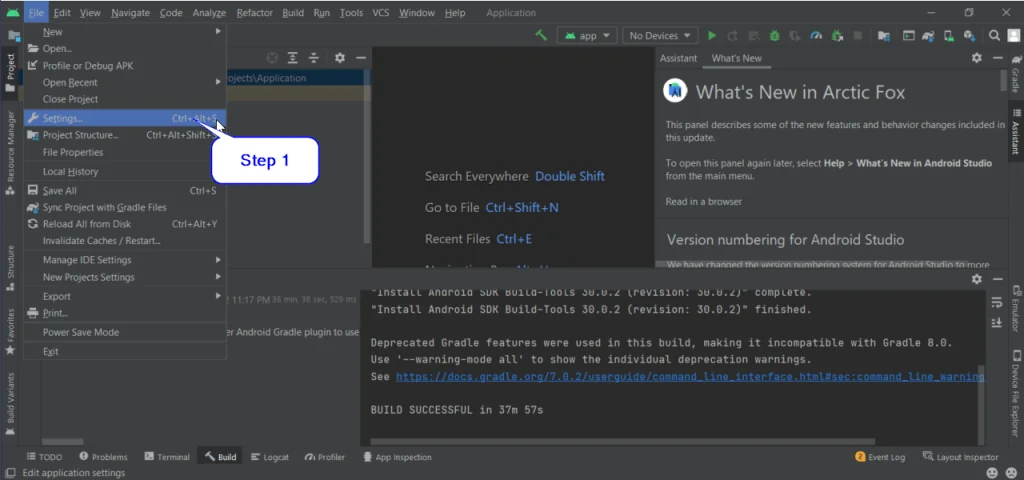
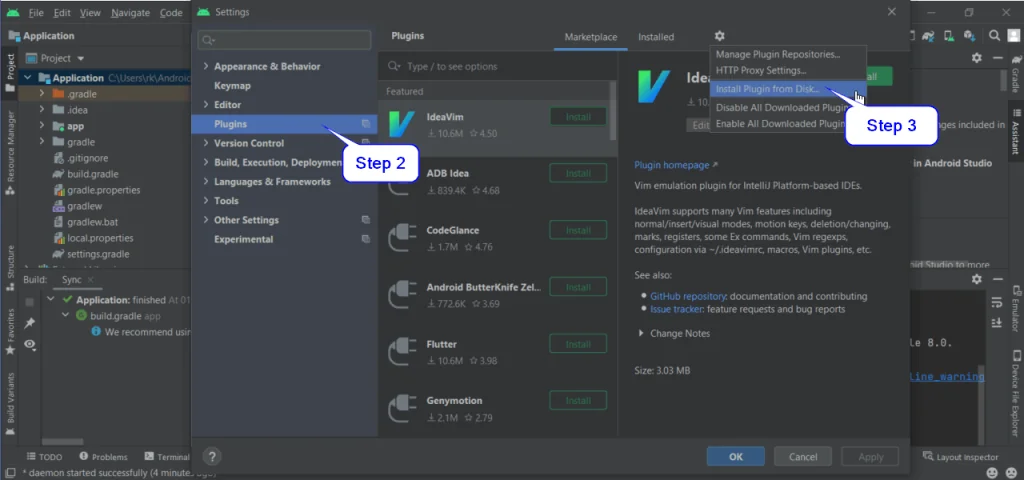
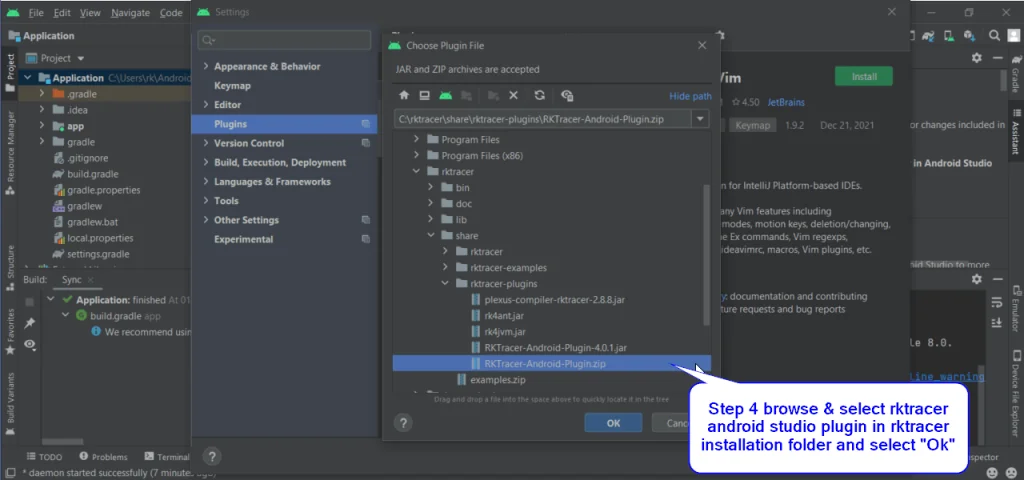
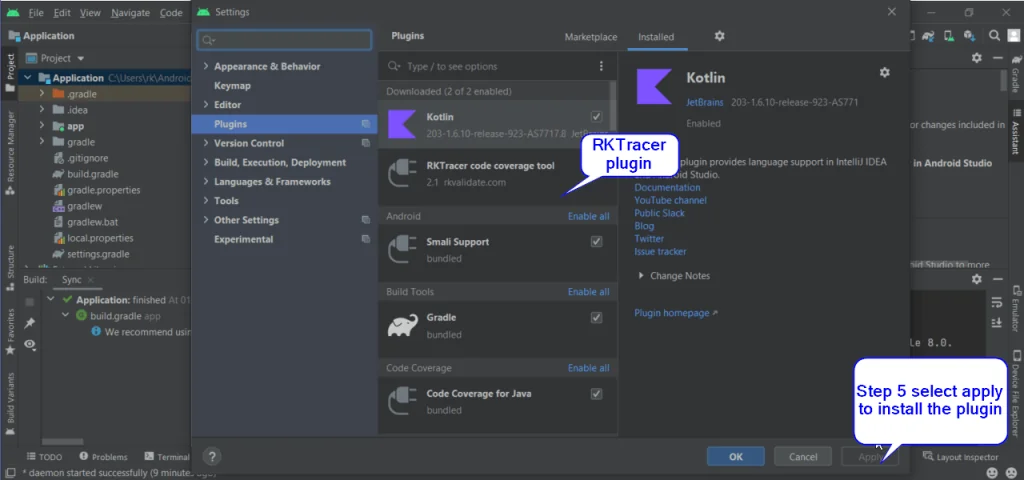
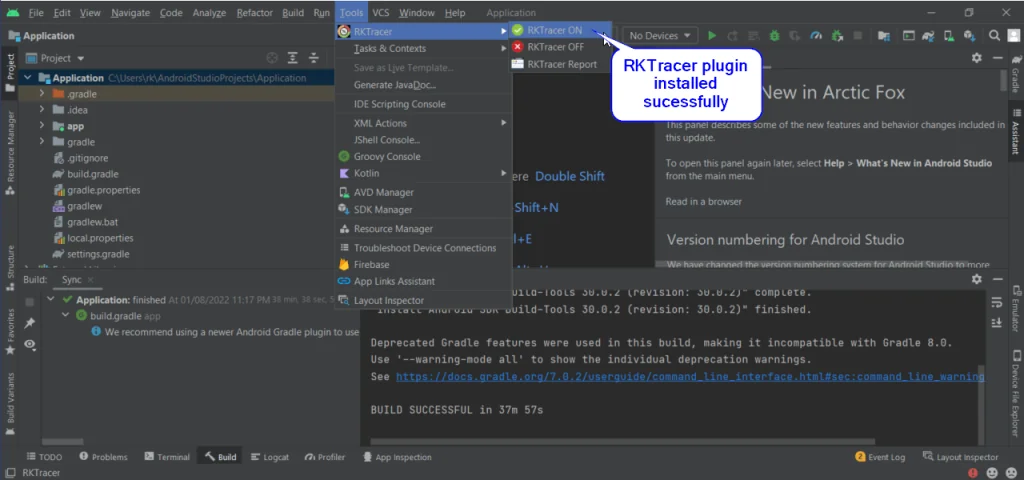
Generate Code Coverage for Android App in Android Studio IDE
Step 1: Enable the RKTracer tool and rebuild the application
Enable code coverage from the IDE menu:
Tools > RKTracer ON
You can also enable RKTracer in command-line mode. Where you would normally run gradlew build, instead run:
rktracer gradle -on app/build.gradle
gradlew clean
gradlew build
Step 2: Test the instrumented application and save coverage data
Run your tests against the instrumented application. Capture the coverage data with adb logcat and pull the rk-coverage.txt file from the device:
adb logcat -c
adb logcat > rk-coverage.txt 2<&1
adb pull /data/data/com.example.widecolor/rk-coverage.txt
Step 3: Generate code coverage reports
Run the rkresults command to generate the HTML reports. The command is the same on Linux and Windows:
rkresults
After generating the reports, disable RKTracer with:
rktracer gradle -off app/build.gradle
Enable coverage for selected files
You can scope coverage to specific folders, files, or functions by editing rktracer.config.
Coverage for selected folders
To instrument source files from some folders while ignoring others, add the following to rktracer.config:
ignore *.java
instrument */power/* */core/* */keys/*
never */firmware_loader/* */lockdown/*
Coverage for selected functions
To generate coverage only for specific functions in specific files, edit rktracer.config:
ignore *.java
instrument *source-file-X.java *source-file-Y.java *source-file-Z.java
function-ignore *
function-instrument fun_X() fun_Y() fun_Z()
Next steps
Once your Android app reports coverage, the same RKTracer workflow applies across other build systems and IDEs. Browse the rest of the documentation, or read more about how RKTracer measures coverage through MC/DC.