Code coverage for CUDA NVIDIA (GPU code) is crucial for several reasons, especially given the increasing complexity and criticality of GPU-accelerated applications in this age. RKTracer measures coverage for both the host code and the device (GPU) code, so you can see exactly which parts of your CUDA application your tests exercise.
For a Bazel build, prefix rktracerbz to your build (rktracerbz bazel build //...). For an nvcc or make build, prefix rktracer. Then run your tests and run rkresults to generate the HTML report.
Why CUDA code coverage matters
Coverage gives you confidence that your tests actually reach the GPU and host code paths that matter. The reasons it is important for CUDA NVIDIA applications include the following.
- GPU code complexity. GPU-accelerated code is increasingly complex, and coverage shows which parts the tests reach.
- Parallel execution. CUDA code runs in parallel across many threads, and coverage helps confirm those paths are exercised.
- Identifying performance bottlenecks. Coverage data helps locate code that is, or is not, being executed.
- Avoiding blind spots and bug detection. Coverage exposes untested code that can hide bugs.
- Regression testing. Coverage helps maintain confidence as the code changes over time.
- Comprehensive testing. Coverage of both host and device code gives a complete picture of what the tests exercise.
Step 1: Build your application with RKTracer
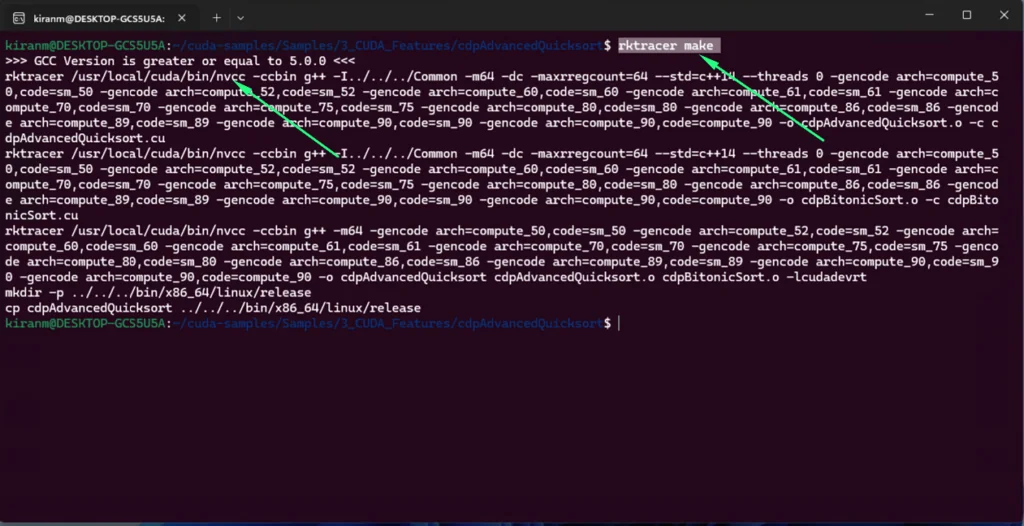
Prefix the rktracer command to your make build command:
rktracer make
When you build this way, RKTracer preprocesses all the source files by the nvcc compiler, then instruments the preprocessed files with coverage collection mechanisms.
Code coverage for CUDA with a Bazel build
Many machine-learning and GPU codebases build their CUDA kernels with Bazel. For those projects RKTracer ships a dedicated single static binary, rktracerbz, the RKTracer enabler for Bazel. You only prefix it to your normal Bazel command, and every C, C++ and CUDA compile action Bazel runs is instrumented, on host and device, with no Bazel plugin, no aspect and no edits to your BUILD or WORKSPACE files.
# prefix rktracerbz to your existing Bazel build
rktracerbz bazel build //...

# or the direct form
rktracerbz build //...
Under the hood, rktracerbz plays two roles. As the launcher it starts the Bazel build; and as the compiler that Bazel invokes for each compile action, it execs rktracer <real-compiler>. So every translation unit Bazel compiles, including your CUDA kernels, is instrumented by the RKTracer pipeline automatically, at full build parallelism. It auto-detects the real compiler, so nvcc, gcc and clang actions are all handled.
AMD ROCm and HIP code typically builds with CMake rather than Bazel, so you use the standard rktracer prefix on that build. The tests and report steps below are the same.
After the Bazel build finishes, run your tests and generate the report exactly as in the steps below: rkresults produces one unified host-and-device coverage report.
Step 2: Run your tests
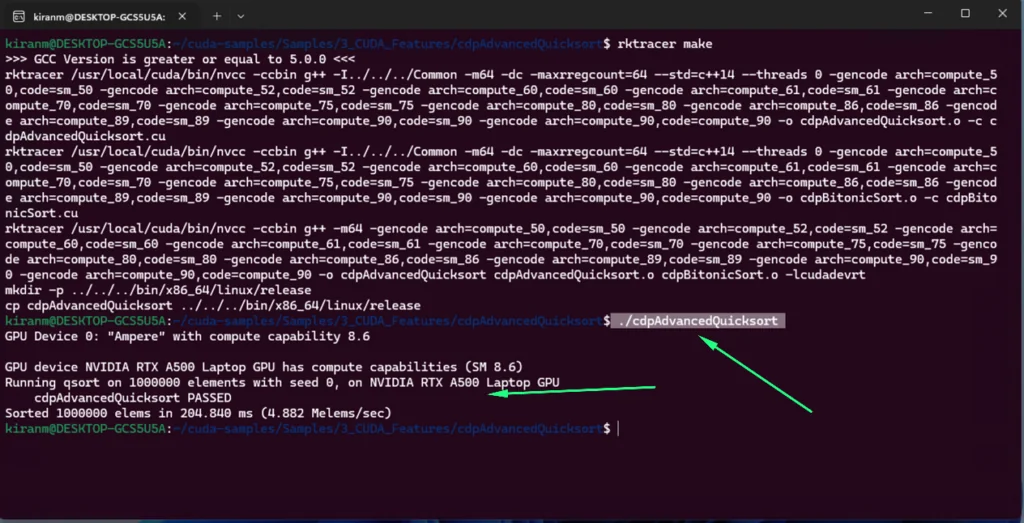
Run your tests against the RKTracer-instrumented application. For example:
./run_tests
As the instrumented application runs, RKTracer captures the coverage data for both the host and the device (GPU) code.
Step 3: Generate the code coverage report
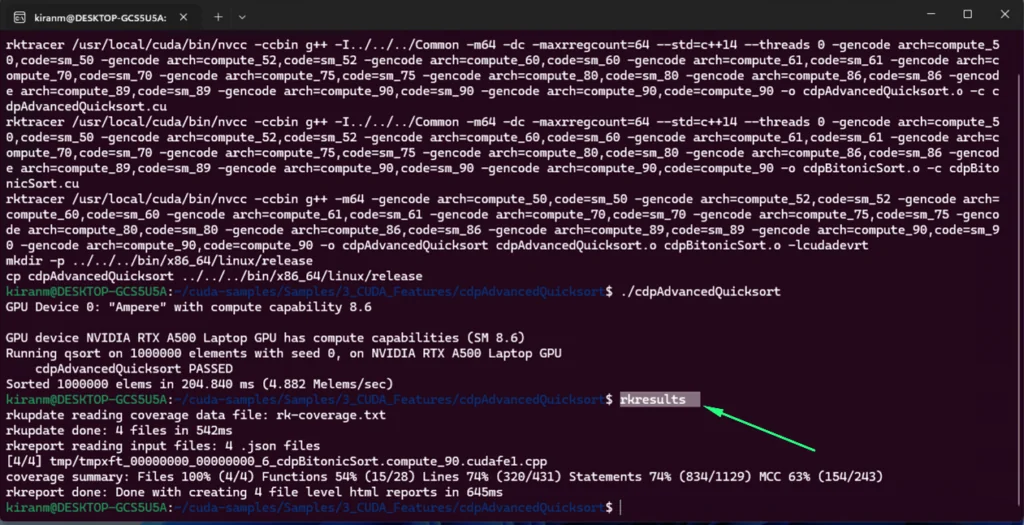
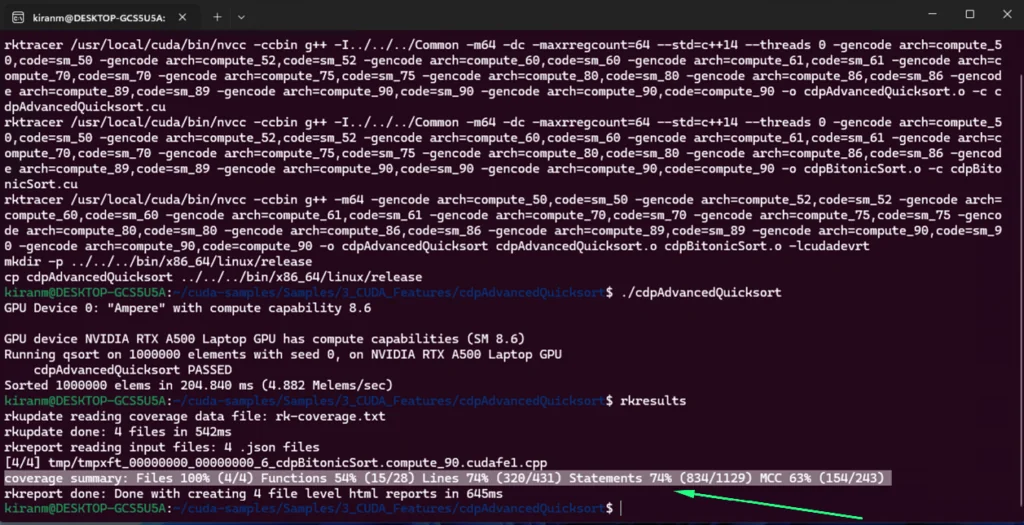
Run the rkresults command to generate the HTML code coverage report:
rkresults
In the report, the lines are color coded:
- Green means fully covered (executed).
- Yellow means partial coverage.
- Red means not executed during the tests.
Enable coverage for selected files and functions
You can scope coverage to specific folders, files, or functions by editing rktracer.config.
Coverage for selected folders
To instrument source files from some folders while ignoring others, add the following:
ignore *.c
instrument */power/* */core/* */keys/*
never */firmware_loader/* */lockdown/*
Coverage for selected functions
To generate coverage only for specific functions in specific files, edit rktracer.config:
ignore *.c
instrument *source-file-X.c *source-file-Y.c *source-file-Z.c
function-ignore *
function-instrument fun_X() fun_Y() fun_Z()
CUDA and Bazel coverage FAQ
How do I measure code coverage for a CUDA project built with Bazel?
Prefix rktracerbz, a single static binary, to your normal Bazel command, for example rktracerbz bazel build //.... It instruments every C, C++ and CUDA compile action Bazel runs, on host and device, with no BUILD or WORKSPACE changes. Then run your tests and run rkresults for the HTML report.
Does RKTracer need a Bazel plugin or aspect for CUDA coverage?
No. rktracerbz is a single self-contained static binary that you prefix to your Bazel build. There is no Bazel plugin, no aspect, and no edits to your BUILD or WORKSPACE files.
Can RKTracer measure both host and device (GPU) coverage for CUDA?
Yes. RKTracer instruments both the host code and the device (GPU) code and produces one unified coverage report, through MC/DC, for nvcc, make, and Bazel builds on Linux.
Next steps
Once your CUDA project reports coverage on both host and device, the same RKTracer workflow applies across other platforms and build systems. See the Host & GPU coverage overview (CUDA, Bazel and ROCm), browse the rest of the documentation, or read how RKTracer measures coverage.